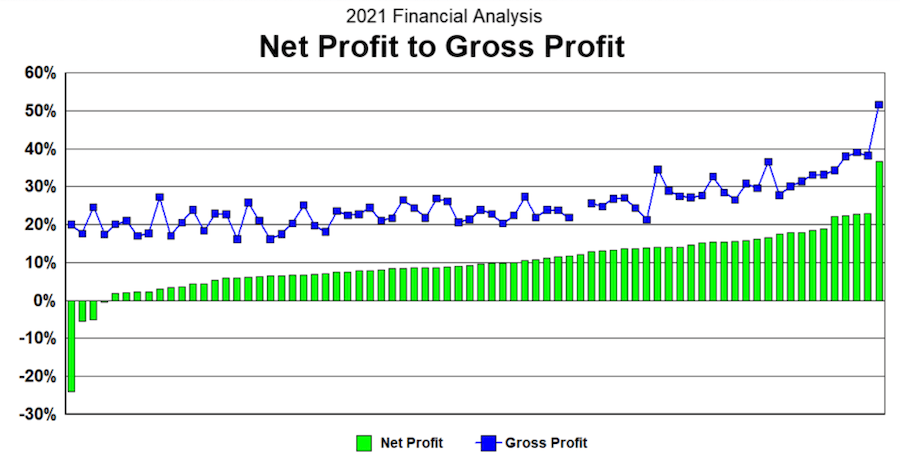
In 2021, home builders recorded the best average net profit—12.06%—in the 29 years that Shinn Builder Partnerships has collected and published detailed home builder financial and operational information. The next-best average net profit of 11.41 was recorded in 2020.
In addition, the average sales volume in 2021 among participating builders jumped 21.1% to more than $94 million—far more than the average revenue of around $75 million for the last few years.
Housing’s Best Decade Ever
In 2020, we published a special report titled “The Roaring 2020s: Housing’s Best Decade,” which outlines why this will be the best decade for housing demand in U.S. history. Here are two main reasons why:
- A housing shortage: The Great Recession and the weak recovery during the last decade are responsible for creating an estimated housing shortage of approximately 3.5 million homes at the start of the 2020 decade.
- Boomers and Millennials on the move: During the 2020s, the two largest demographic groups will need and want to change housing accommodations. Baby Boomers who postponed their relocation during the last decade are the retiring empty nesters entering their last stage of housing demand. And Millennials are finally having families and embracing a suburban, single-family lifestyle. In addition, the front end of Generation Z (Zoomers) is entering the rental housing market. This wave of housing demand began in the second half of 2019, when the 30-year mortgage interest rate dropped to historical lows under 4%. Builders began 2020 with strong backlogs of sales and demand.
RELATED
- Downturn Revisited—Why Efficiency Wins Every Time for Your Business
- Why You Need a Backup Plan for a Housing Market in Flux
- Even Flow: The Heartbeat of a Production Builder
Housing Industry Performance Analysis
We recently released the 2021 Home Builders Comparative Financial and Operational Analysis. The analysis is a representative sample of responses from companies involved with Builder Partnerships’ rebate program, Home Builder University training programs, and clients of Shinn Consulting. Participants are private home builders geographically dispersed throughout the U.S. and Canada. Among them, the average sales volume for 2021 was $94 million, with a range from $1 million to over $600 million. Nearly one-third (30%) of these builders reported revenue of more than $100 million.
Home Sales and Revenue
These builders sold an average of 215 homes in 2021, with 62% selling more than 100 units, 19% selling 50 to 100, and 19% selling 1 to 50. The average sales price was $575,000, with a range of below $200,000 to over $5.6 million. Builders recording losses represented 6.5% of the participants, while 37.8% generated net profits in excess of 12%, with 6.8% recording net profits of more than 20%, which comes out to an average net profit of 12.06%—a record in the 29-year history of our survey (see chart, below).
In addition, the average cost of sales (land and direct construction costs) was 73.74% of sales revenue, which generated a gross profit of 26.26%; within that, land represented 18.6% and direct costs 55.2% (see chart, below).
Cost of Sales
Comparative Performance
2006-2021 Averages
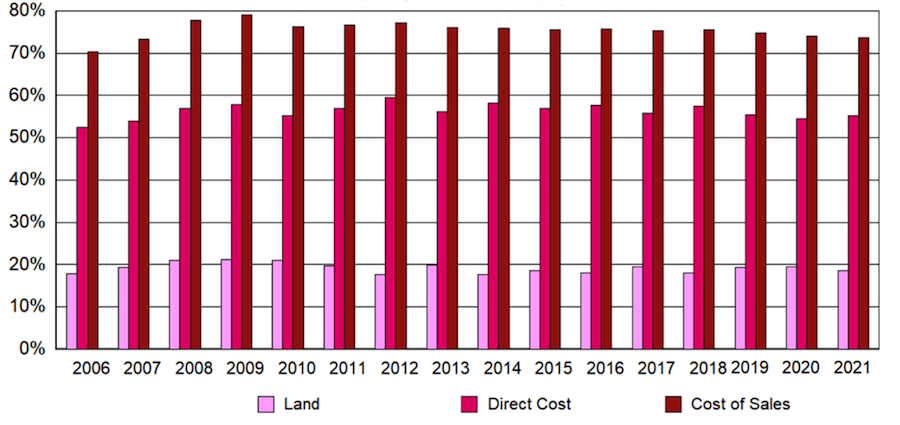
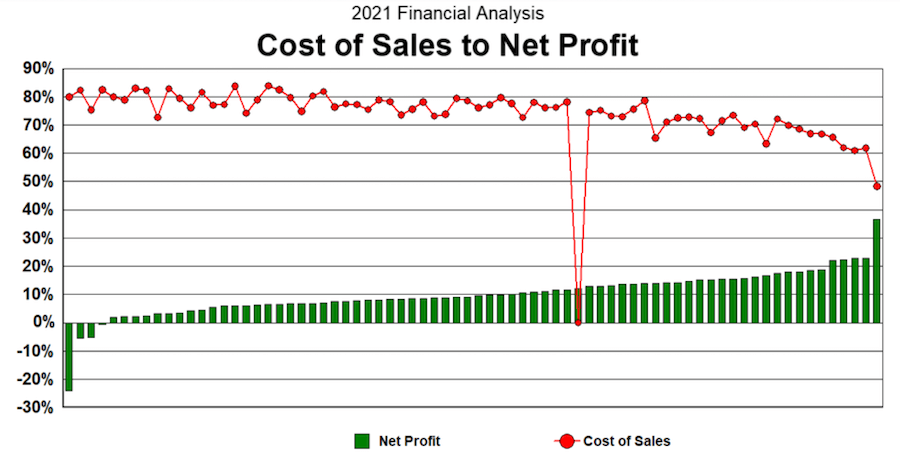
As a housing consultancy, we prefer that the cost of sales represents 70% or less of sales revenue. Historically, land represents about 20% and direct construction costs need to be controlled to about 50% to generate a 30% gross profit. Over our 50-plus years in this industry, we’ve determined that a good gross profit is the first line of defense for a good net profit (see chart, below).
Operating Costs
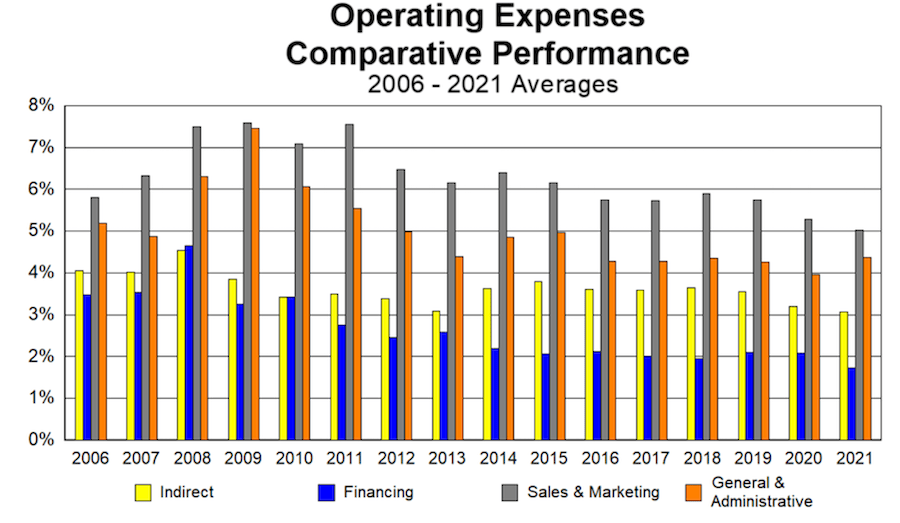
The 2021 report also revealed that home builder operating expenses—consisting of indirect construction costs, financing expenses, sales and marketing expenses, and general and administrative expenses—averaged just 14.2%, which is low based on historical averages of about 18%. The results show the indirect construction costs in equilibrium with the revenue realized, at slightly over 3%, and the general and administrative expenses also in equilibrium at about 4.4%. These costs and expenses include staff and other types of fixed costs, which are some of the most difficult costs to manage because they need to be adjusted in the face of a deteriorating housing market and reduced sales revenue.
Financing Expenses
According to the survey, financing expenses were just 1.1%. However, with increases in interest rates, cancellations, inventories, construction time, and customer concessions, financing expenses are set to go up by an average of between 4% and 5% in the foreseeable future. Sales and marketing expenses registered an average of slightly over 5% of revenue, which is in line with the adoption of internet marketing and sales procedures. This classification will also increase from 2%–3% to 7%–8% of revenue in a down market to stimulate sales with additional marketing and sales concessions.
Cycle Time
Due to supply chain disruptions and the skilled construction labor shortage, cycle times have extended quite a bit in the last couple of years. It’s important to work on reducing cycle times, as this affects cash flow, capital requirements, indirect construction costs, financing expenses, general and administrative expenses, and, ultimately, profits. Another operational observation is the deterioration of management systems and processes as a result of increased volume and extended schedules over the last couple of years.
Obstacles and Challenges Facing Home Builders
Once the COVID-19 virus was declared a pandemic in March of 2020, many people forced to work from home experienced “cabin fever” and began to rethink their housing and lifestyle choices, stimulating housing demand. The relationship between home and in-office work became largely disconnected as people moved farther from their workplaces to the urban fringe and smaller urban areas, a dynamic labeled Suburban Shift, among other terms.
With that, the federal government’s $3 trillion stimulus package in the throes of the pandemic enabled personal savings to increase to an all-time high and more buyers to afford down payments for housing purchases. The Federal Open Market Committee (FOMC) reduced the Federal Reserve funds rate to zero on March 15, 2020, with no increases for two full years. As a result, mortgage interest rates dropped to record lows of below 3% for a 30-year fixed rate loan.
But the Biden administration coming to power in January 2021 also radically changed the priorities of the government to be more expansionary. At the time, inflation was nonexistent, with Consumer Price Index (CPI) growth of just 1.45%. The result of the transition was an overstimulation of the economy, with $9 trillion of additional fiscal stimulus, and counting.
As a housing consultancy, we prefer that the cost of sales represents 70% or less of sales revenue.
The administration initially denied inflation as only transitory, with no long-term impact on the economy. The FOMC finally acted on March 16, 2022, with a timid 25 basis-point increase, and another 50 basis-point increase in May. By June 2022, the CPI increased 9.1%, and the Producer Price Index (PPI) increased 11.3%, the highest increases for both in 40 years.
In 2022, the FOMC raised the Federal Reserve funds rate six times, for a total of 375 basis points, with two more increases expected during the first quarter of 2023.
By October 2022, the CPI increase had dropped to 7.7%, but the core inflation rate was still strong at 6.3%, with energy increasing 17.6%, and food at home 12.4%. The October PPI increase was 8%, with a 17.3% increase for all inputs for residential construction.
The Future for Housing: Market Contraction, Rising Inflation, Recession
The historical and oft-used definition for an economic recession is two consecutive quarters of negative growth, which occurred during the first half of this year. Builders typically miss the cycle turns for a recession or a recovery, as many consider slowdowns in sales as seasonal and build spec homes for the next year’s selling season.
As economists predict a recession during the first half of 2023, at the peak of the annual homebuying season, it doesn’t look like it will be a soft or short landing for the housing industry. The Biden administration’s actions continue to be expansionary, with no fiscal restraint, leaving the inflation battle to the Federal Reserve to solve. And, because housing is a highly leveraged industry exposed to monetary policies and interest rates, it’s bearing the brunt of the Fed’s actions to gain control of the current runaway inflation.
Because it’s a highly leveraged industry that is exposed to monetary policies and interest rates, the housing industry is bearing the brunt of the Fed’s actions to gain control of the current runaway inflation.
No matter whether or when an economic recession is officially declared, housing itself is already in the early stages of a recession. In our estimation, builders should be prepared for a sales contraction of 30% to 50%, with selling prices declining between 15% to 20%, which aligns with plans among many of the builders in our networks.
In October, new-home sales declined 14.2% from 2021. Monthly sales have consistently declined from January 2021 to 31.4% below the January rate of sales. In 2022, total new-home sales were down 14.2%. Private builders are currently experiencing 40% to 50% declines in traffic and sales, and inventories are 21.3% higher since the beginning of last year, representing 9.7 months of supply; completed inventory has increased 85.3% (see charts, below).
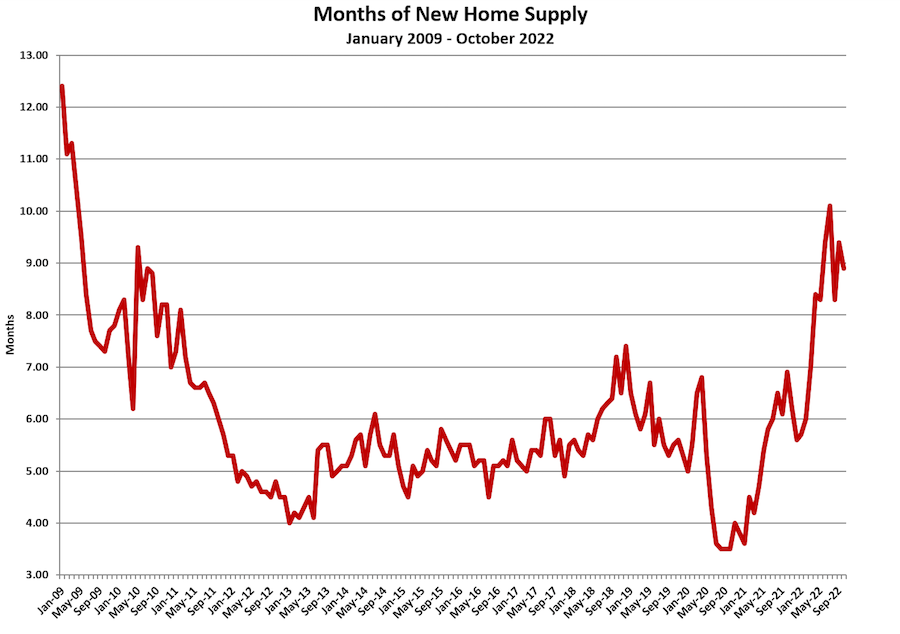
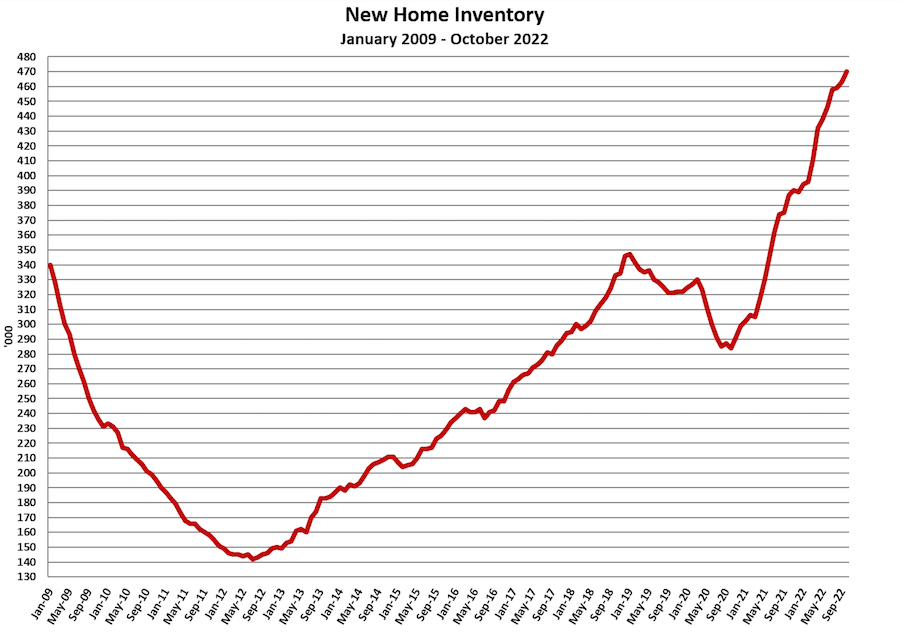
During 2021, builders moved from pre-sales to speculative building because of escalating construction costs. Today, with the market transitioning from a seller’s market to a buyer’s market, inventories could spike. We see builders beginning to pull back on starts to control expanding inventories.
RELATED
- Can We Make Home Building a Little Less ‘Interesting?’
- A Six-Step Strategy to Reset Material and Labor Costs
- Good or Great: What Distinguishes Good Home Builders From Great Ones?
The need for housing remains strong, but housing demand has three components: need, desire, and ability. The rapid increase of interest rates during 2022 has affected homebuyers’ desire and ability to purchase a new home. Once inflation is tamed and mortgage interest rates stabilize between 4% and 5%, housing demand will return rapidly with homebuyers back in the market. In fact, we see evidence of that now, as rates have dropped and stabilized somewhat during the first month of 2023.
Action Plan for Home Builders in an Unsettled Housing Market
As home builders plan for what we expect to be a turbulent environment in 2023, we advise them to take action on several fronts:
- Develop a business plan. Home builders should develop a survival business plan based on a 30% to 50% drop in sales revenue and outline the actions to be taken based on the new anticipated sales volume.
- Get financing in order. Get your financial house in order and hoard cash because cash is king during a softening economy.
- Diversify financial partners. Diversify your financial institutions. Banks can get into trouble, too. Watch your lines of credit and cross-collateralization of loans.
- Maintain transparency with lenders. Don’t hide from your bankers and investors. Share your survival business plan for how you are going to work through the recession.
- Manage debt. Work on reducing your debt and renegotiate your loans before they get into trouble.
- Manage spec inventory. Establish a game plan to liquidate and get rid of your spec homes. Determine the maximum number of specs per community. Establish a policy in which you can start a spec home if you sold a spec so they don’t accumulate in slow-selling communities.
- Manage land inventory. Get rid of your excess land inventory. Land-holding costs take down many builders during a recession. Put together a land holding group with outside investors for land banking current land and prepare for land acquisition during the recovery.
- Reduce direct construction costs. Consider your current house plans and work to reduce your specifications and features, as most homes have been “overloaded” during the last several years. For new plans, reduce square footages; improve your purchasing processes, procedures, and negotiating strategies; and reduce construction waste.
- Make trade partners part of the team. Work with your trade partners to improve construction efficiencies and reduce costs.
- Manage overhead. Consider reducing staff to maintain a proper (or better) balance with sales volume.
- Reduce pre-construction and construction cycle times. Develop reasonable schedules for both and stick to them.
- Design new product. Create new product lines that are more efficient, smaller, and cheaper to build. Design product for the new reality of higher interest costs and higher monthly mortgage payments. Buyers can’t afford as much house as they could last year. Remember: Discounting sales prices on your old product is 100% loss of profit.
Act to Seize Opportunities
This recession will present its share of opportunities, but builders must be proactive with plans of action and strategies for taking advantage of opportunities. The recession will weed out some builders, allowing you to fill the voids and increase your market share.
People will still buy homes during the recession, so do some market research to determine who is buying and what they are buying. Then tailor a housing product to cater to active homebuyers.
During the last two years, builders grew beyond their capabilities. Many experienced what we refer to as the “high-speed wobbles”; they outgrew or abandoned their systems and procedures. The slowdown will allow builders to realign their systems, policies, and procedures, and to improve the quality of their staff, with more qualified talent to prepare for the recovery.
Also, maintain relationships with your banks and get to know the REO (real estate owned) agents so you can consider serving as the GC for workouts on bank-owned properties to finish projects and generate cash flow. Land developers will need home construction to liquidate land holdings, which can be great opportunities to create cash flow.
Foreclosures will come toward the end of the cycle. These can be land developments, projects and communities, and individual houses. Land acquisition can come from public builders and private land developers abandoning their positions in the market. There will be less competition and you will be able to negotiate better terms, conditions, and pricing.
Successful builders can grow during this housing recession if they plan for it. Maintain a good reputation in the market with good liquidity and actively search for opportunities.
The market for housing is still very strong for this decade. Once the Fed gains control of inflation and mortgage interest rates stabilize, homebuyers will be back with a strong need for housing. As homebuyers get more comfortable with the new market conditions, and home prices come down to reestablish affordability at the new mortgage interest rates, demand will return rapidly. I still believe this decade is going to be the best decade ever for housing.
Chuck and Emma Shinn are co-founders of The Shinn Group, Shinn Builder Partnerships, and related entities dedicated to helping home builders improve operational performance and practices. They have conducted an annual financial and operational survey and analysis of more than 100 home builders since 1993.


