|
||||||||||||||||||||||||||||||||||||||||||||||||||||||||||||||||
The Labor Department's construction materials composite price index, declined by 0.3% between April and May, erasing all of the gain recorded the month before. This broke a string of six consecutive months of generally rising price levels in the construction market, and brought the May 2000 composite index to a level just 1.8% above its reading for the fifth month of 1999. On an annual average basis, the construction materials price index moved up 1.0% between 1998 and 1999 after declining by 0.5% over the previous year, and had accelerated to a moderate 1.7% annualized rate by the time we reached the final quarter of last year. So, although the current annual inflation rate doesn't represent any improvement over the late-1999 rate, it doesn't represent much in the way of deterioration either. And with demand in construction markets expected to slow during the second half of this year, price pressures should continue to ease.
About as many construction products were flat-to-down in price as were rising in price during the first third of 2000. After the annualized inflation rate for gypsum products soared to more than 23% during the final months of 1999, prices at first stabilized and then began to retreat during the first five months of this year. The price index for this volatile product group fell 6.5% between February and May. Average prices this May were "only" 6.3% higher than in May 1999-still a significant increase, but well below the 23.1% gain registered between December 1998 and December 1999.
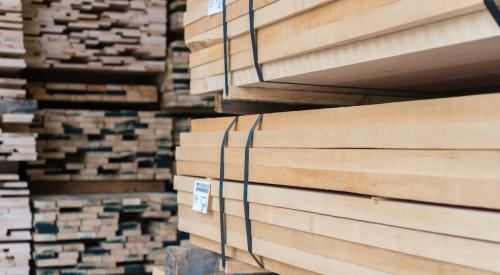
Average lumber prices also moved sharply lower during May after rising steadily throughout most of the past year, and have now fallen for three consecutive months. The 3.4% April-to-May dip followed a 0.9% decline the month before, and left average lumber prices a surprising 4.7% lower this May than during May 1999. Average lumber prices during the first five months of this year were 2.5% above the January-May 1999 average level, after rising by an average of almost 5% for full-year 1999. Average roofing material prices increased sharply again between April and May. The Labor Department reported that average May 2000 prices for asphalt/tar strip shingles were 2.6% higher than the month before, and 7.7% above the May 1999 average. The rising cost of petroleum product inputs has worked its way into the price of this final product - although not quite to the degree that higher oil prices have impacted some other manufacturing input prices.
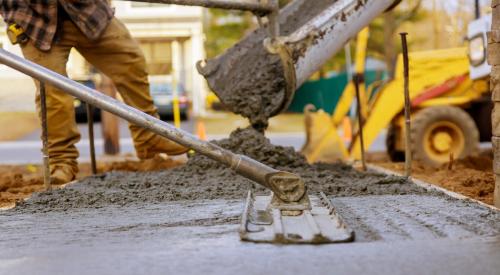
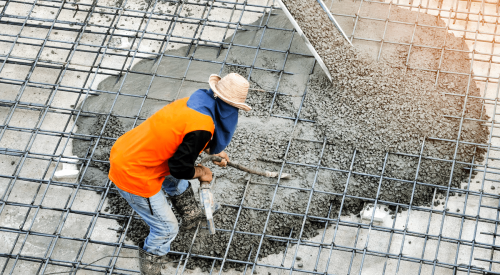
Average ready-mixed concrete prices also rose sharply during May after appearing to stabilize during April. Prices nationwide were up a sharp 1.1% between April and May of this year after holding steady the month before, and concrete was on average 1.8% more expensive over the first five months of 2000 than during the January-May 1999 period.
Ceramic tile product prices also moved moderately higher between April and May, after declining by a steep 2.2% between March and April. The price index for this product group rose 0.5% in May, but average tile prices remain 1.3% below where they ended 1999. And average prices during May of 2000 were 2.0% lower than during the same month of 1999.
Moving in the opposite direction from roofing, concrete, and tile prices during May were average prices for fabricated structural metal used in construction. Between April and May, the price index for this product group fell 0.9% after increasing by 1.1% the month before. The May 2000 price index for this product group was 3.4% higher than a year earlier, however, after registering only modest inflation of 1.5% for full-year 1999.
Also See:
Housing Starts
Consumer Confidence by Region
New Residential Building Permits by Region
Recent Trends In New Residential Permits for 1999’s Top 25 Metro Areas
