|
||||||||||||||||||||||||||||||||||||||||||||||||||||||||||||||||||||||||||
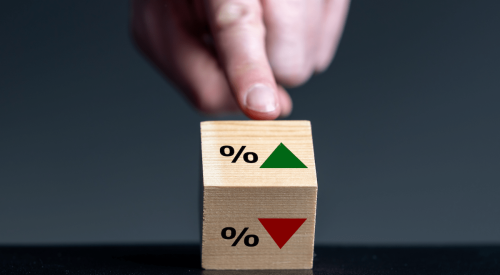
Although the Federal Reserve Board has tried to slow the fastcharging U.S. economy by raising short-term interest rates by almost two percentage points over the past year, there''s been little apparent loss of long-term growth momentum. In late August, the Commerce Department reported that the economy''s Gross Domestic Product (GDP) grew at a vigorous 5.3% annual rate from April through June of this year, even faster than during the first quarter of 2000.
The personal consumption expenditures (PCE) component of GDP did, in fact, show that higher interest rates were finally beginning to have a significant impact on consumer spending -- just as the Fed had hoped and anticipated when it started raising short-term rates during June 1999. PCE grew at a 2.9% seasonally-adjusted annual rate during the second quarter of this year -- the slowest rate since the second quarter of 1997. By contrast, PCE had soared at a 7.6% annual rate during the first three months of 2000 -- the sharpest quarterly gain in 17 years! And spending for durable consumer goods -- like cars, electronic products, and large household appliances -- actually declined at a 5.0% annual rate during the April through June 2000 period.
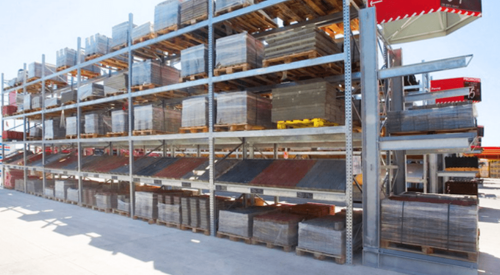
But this pullback by shoppers was more than offset by exceptionally strong growth in business investment and inventory accumulation. Capital spending for new equipment and software had grown at a seemingly unsustainable 20.6% annual rate dur- ing the first three months of this year -- a rate far in excess of even the extraordinary 12.2% average annual increase recorded during the previous four years. But preliminary estimates peg second- quarter business investment spending at almost as high a level as in the first quarter of the year, with a 17.8% annualized increase. And business spending for new buildings -- which had declined by 1.4% between 1998 and 1999 -- was reasonably strong for the sec- ond consecutive quarter, with January through March annualized growth of 22.3% being followed by a solid 4.8% gain during April through June 2000. In addition, government spending increased by a surprisingly strong 4.9% during the second quarter of this year after falling at a 1.1% annual rate over the first three months of 2000.
All-in-all -- despite the slowdown in consumer spending -- the secondquarter 2000 GDP report was hardly the picture of moderation for which economic policy makers had been looking. On the surface, the U.S. economy still seemed to be growing too fast for comfort during the first half of 2000 -- "too fast" at least by the standards established by monetary policy makers at the Fed. But maybe a "real" slowdown is imminent, especially given the growth-sapping potential of the second-quarter inventory bubble. And maybe the productivity gains that have accrued to the economy during the 5-year surge in business investment spending can continue to hold inflation at bay. If so, the Fed won''t feel compelled to raise interest rates further in order to slow economic growth down to the presumptive non-accelerating inflationary "speed limit" of 3.5% to 4.0% annualized gain in GDP.
|
||||||||||||||||||||||||||||||||||||||||||||||||||||||||||||||||||||||||||


