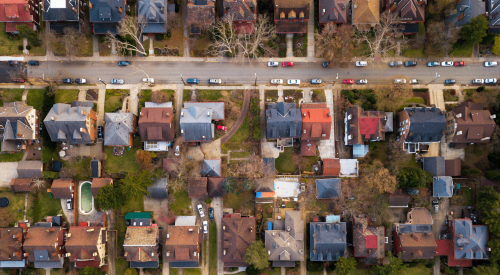
The Urban Institute designed an interactive graphic that gives viewers a sense of how things will change in the United States over the next five to 15 years.
The map can be adjusted to depict rates for birth, death, and migration levels for both 2020 and 2030. The data show that the U.S. will become both older and more diverse in the coming decades, as the elderly and Hispanics make up a greater proportion of the population.
PB Topical Ref


