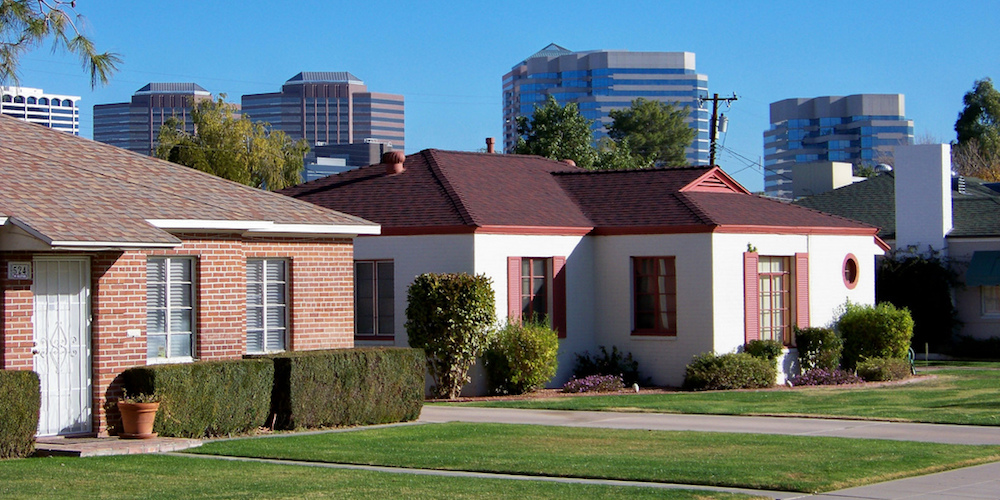
Over the last five years, buyers in Phoenix have been able to find a better mix of luxury and entry-level housing across the city’s many neighborhoods. In Detroit, however, the chasm between the haves and have nots is growing further apart.
Trulia studied home values, both rental and owner-occupied, in the nation’s 100 largest metros, and charted progress made since 2011. The site found that, as a nation, housing is becoming less economically segregated, giving homebuyers more choices.
Trulia calculated an index that measures segregation of home values based on a 100-point scale. A higher number indicates more economic segregation (for instance, a score of 65 would say that 65 percent of a city’s neighborhoods are in the most extreme categories).
Phoenix, San Diego, and Cape Coral, Fla., have had the largest positive change in home value diversity since 2011. Phoenix’s 2016 index score of 35.28 is down from 56.34 in 2011. Meanwhile, Detroit, Charleston, S.C., and New York City have had the largest gains in housing value segregation. Detroit’s recovery has been exceptionally uneven: It’s 2016 index was 72.2, up from 49.9 in 2011.
It turns out that the metros that saw the largest increases in home value segregation mostly saw the proportion of the inexpensive neighborhoods increase, except for New York, Allentown, Pa., and Boston. In other words, metros with the largest increases in home value segregation actually saw the gap between the most and least expensive homes grow at the bottom end of the market. In other words, the share of least-expensive neighborhoods grew.
And, Trulia notes that some of the cities with the highest rates of home value segregation, such as Detroit and Milwaukee, also have high rates of racial segregation. It does not imply a causation or correlation, the site says.


