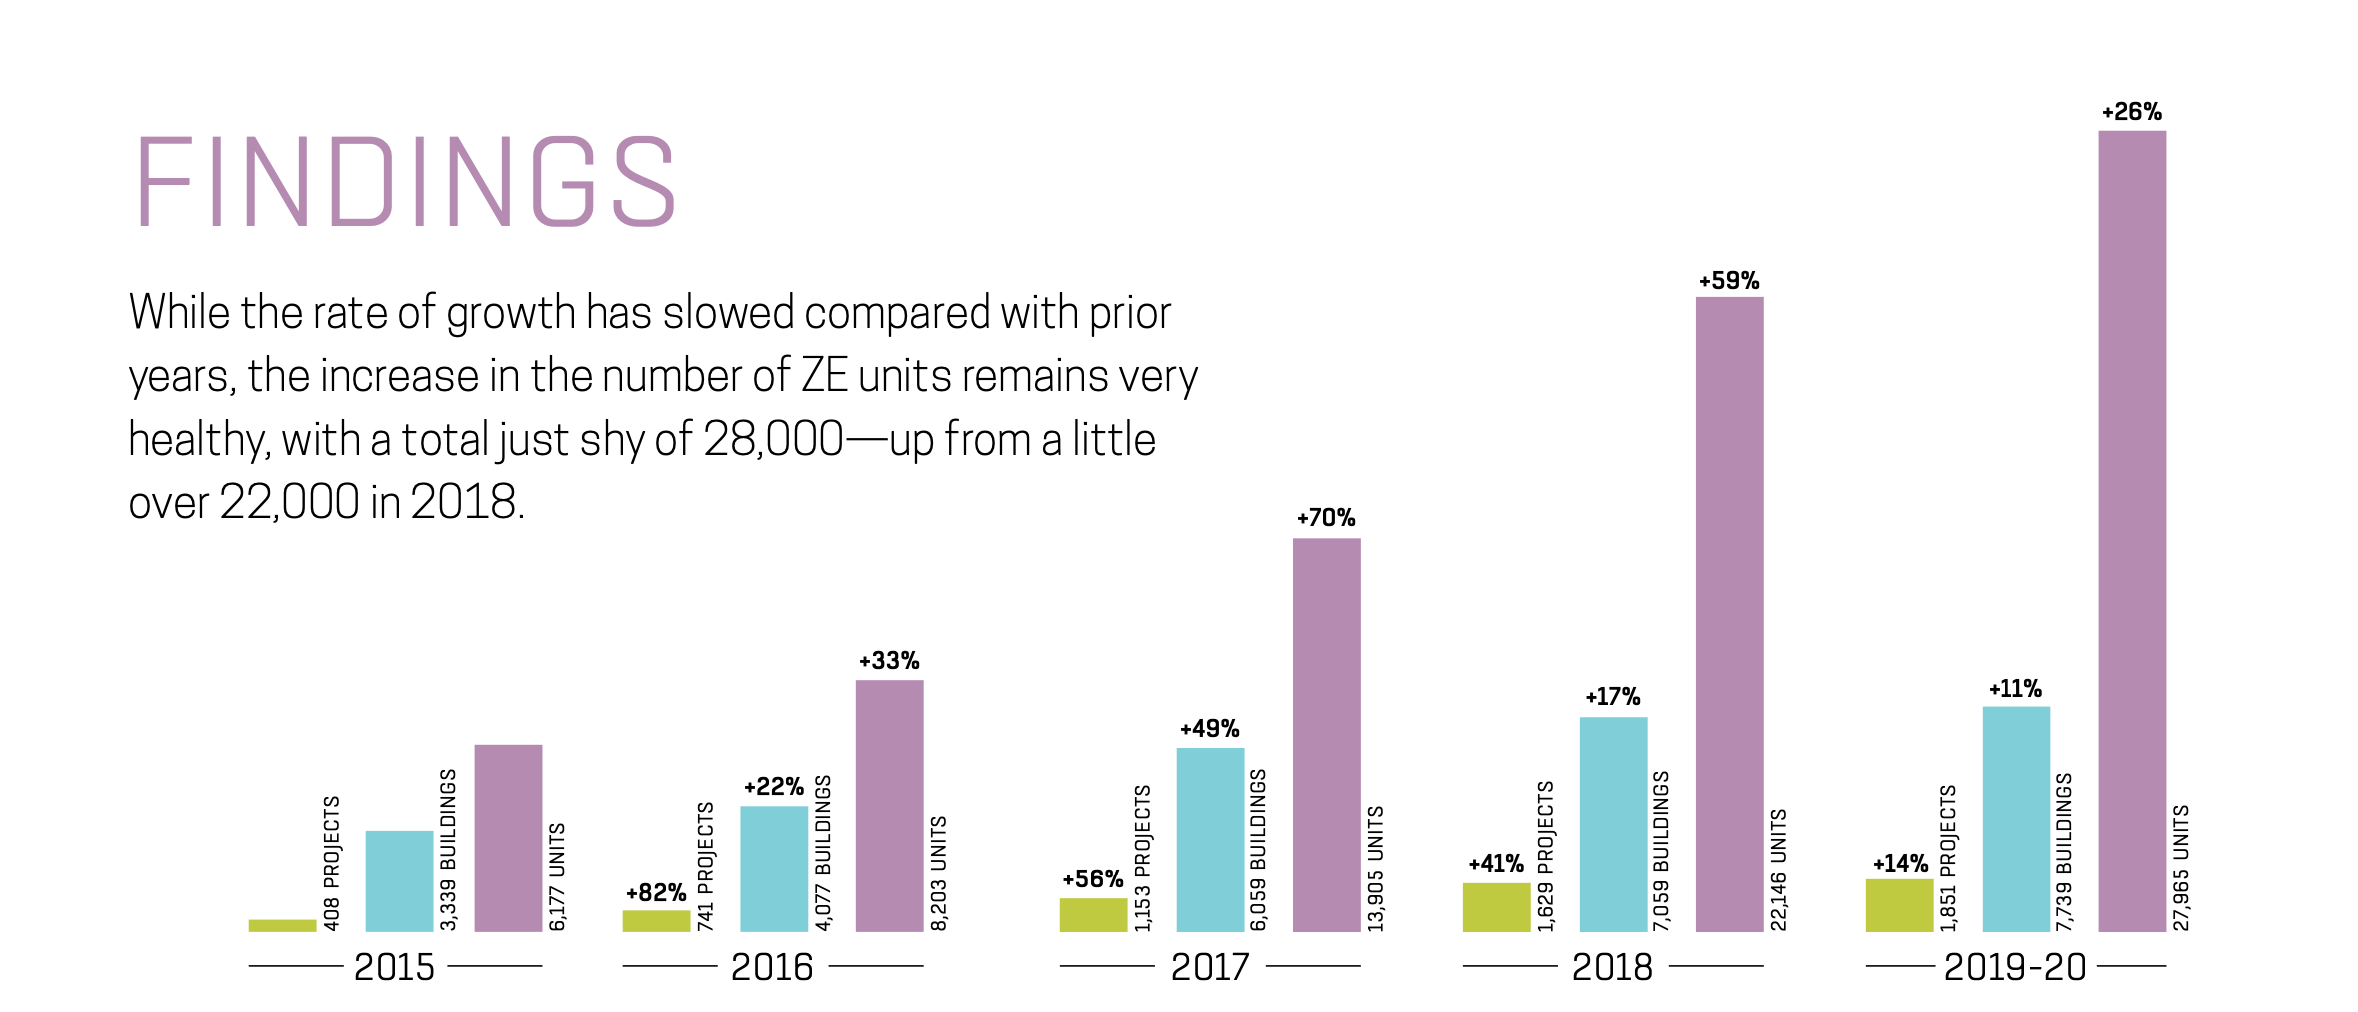
The 2021 Zero Energy Ready Home Study from EEBA/TEAM ZERO shows how homes are becoming more energy-conscious each year. With the growing number of zero energy units in North America—a 26% increase from 2018—EEBA continues to see more and more builders adapting to the zero energy model.
In the United States, TEAM ZERO has reported a total of 17,876 zero energy multifamily units, and 6,671 single-family units as being in design, under construction, or completed—a total of 24,547 units. Including the zero energy projects from Canada, the total amount of reported units is 27,965.
Within this report, the term “zero energy” is used expansively. While it suggests precision, it simply seeks to include all residential zero energy (ZE) developments that are designed to achieve energy performance in the realm of zero. All projects designed with this aim contribute to creating a clean energy future, and help to explain the overall evolution of the ZE market.
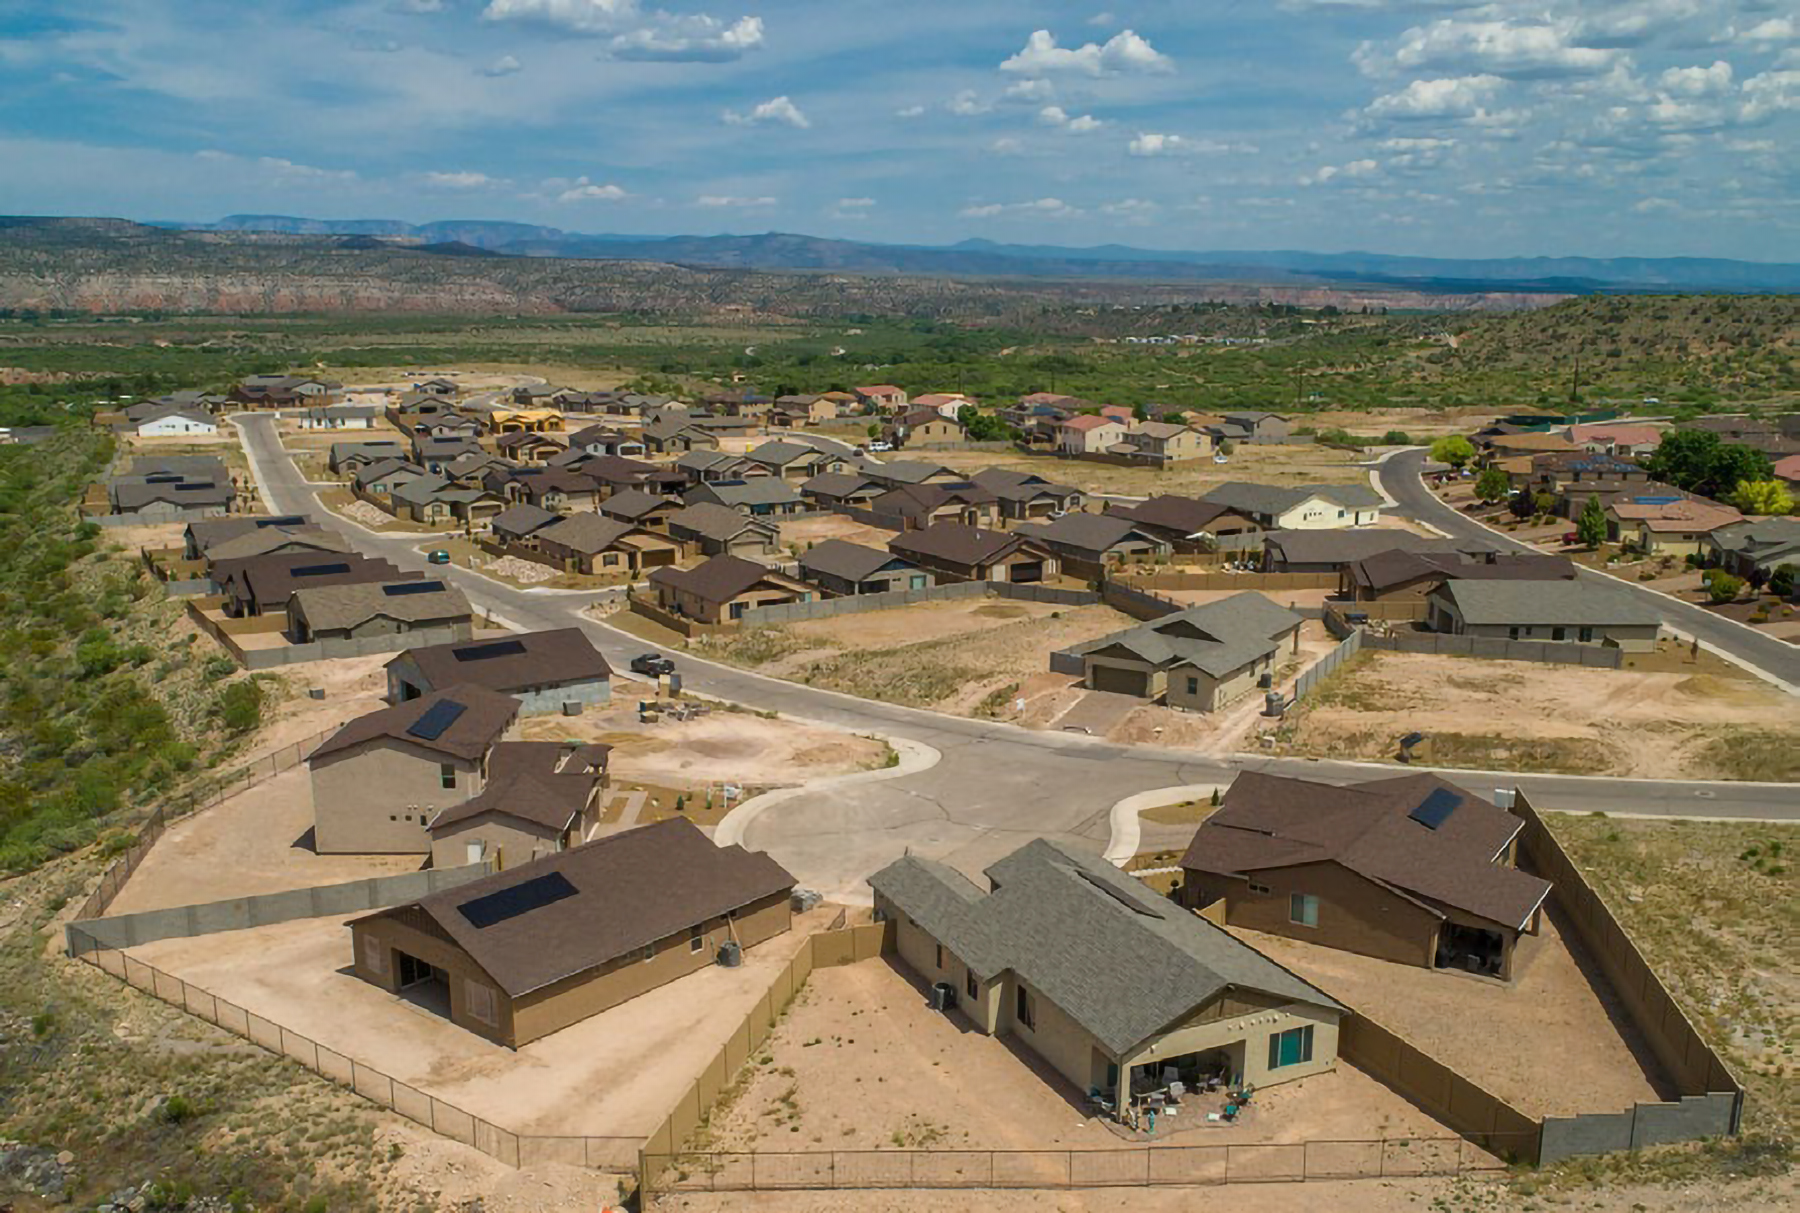
One example of a large zero energy project is Mandalay Homes. With over 300 zero energy ready units under construction in Arizona, this development makes up 79% of Arizona’s single-family ZE homes. Though it currently holds the title for the largest project of its kind, the study finds that there may be many more to come
TRACKING THE ZERO ENERGY LANDSCAPE
A big finding in this year’s report is the substantial bump in energy performance. Percentage of zero energy units jumped ten points, from 29% in 2018 to nearly 39%. Most of the increase comes from these units climbing out of the ZE-ready category.
The difference here is that a true zero energy home supplies 100% or more of the annual energy demand, while a zero energy ready home can supply 90% or more of the demand, or could if/when renewable energy is added to the unit—according to EEBA.
Additionally, project size has remained consistent. The average single-family development in 2019/20 comprises 24 homes, compared to 26 homes in 2018. However, the average multifamily project has 62 units, a slight increase from 59 units in 2018.
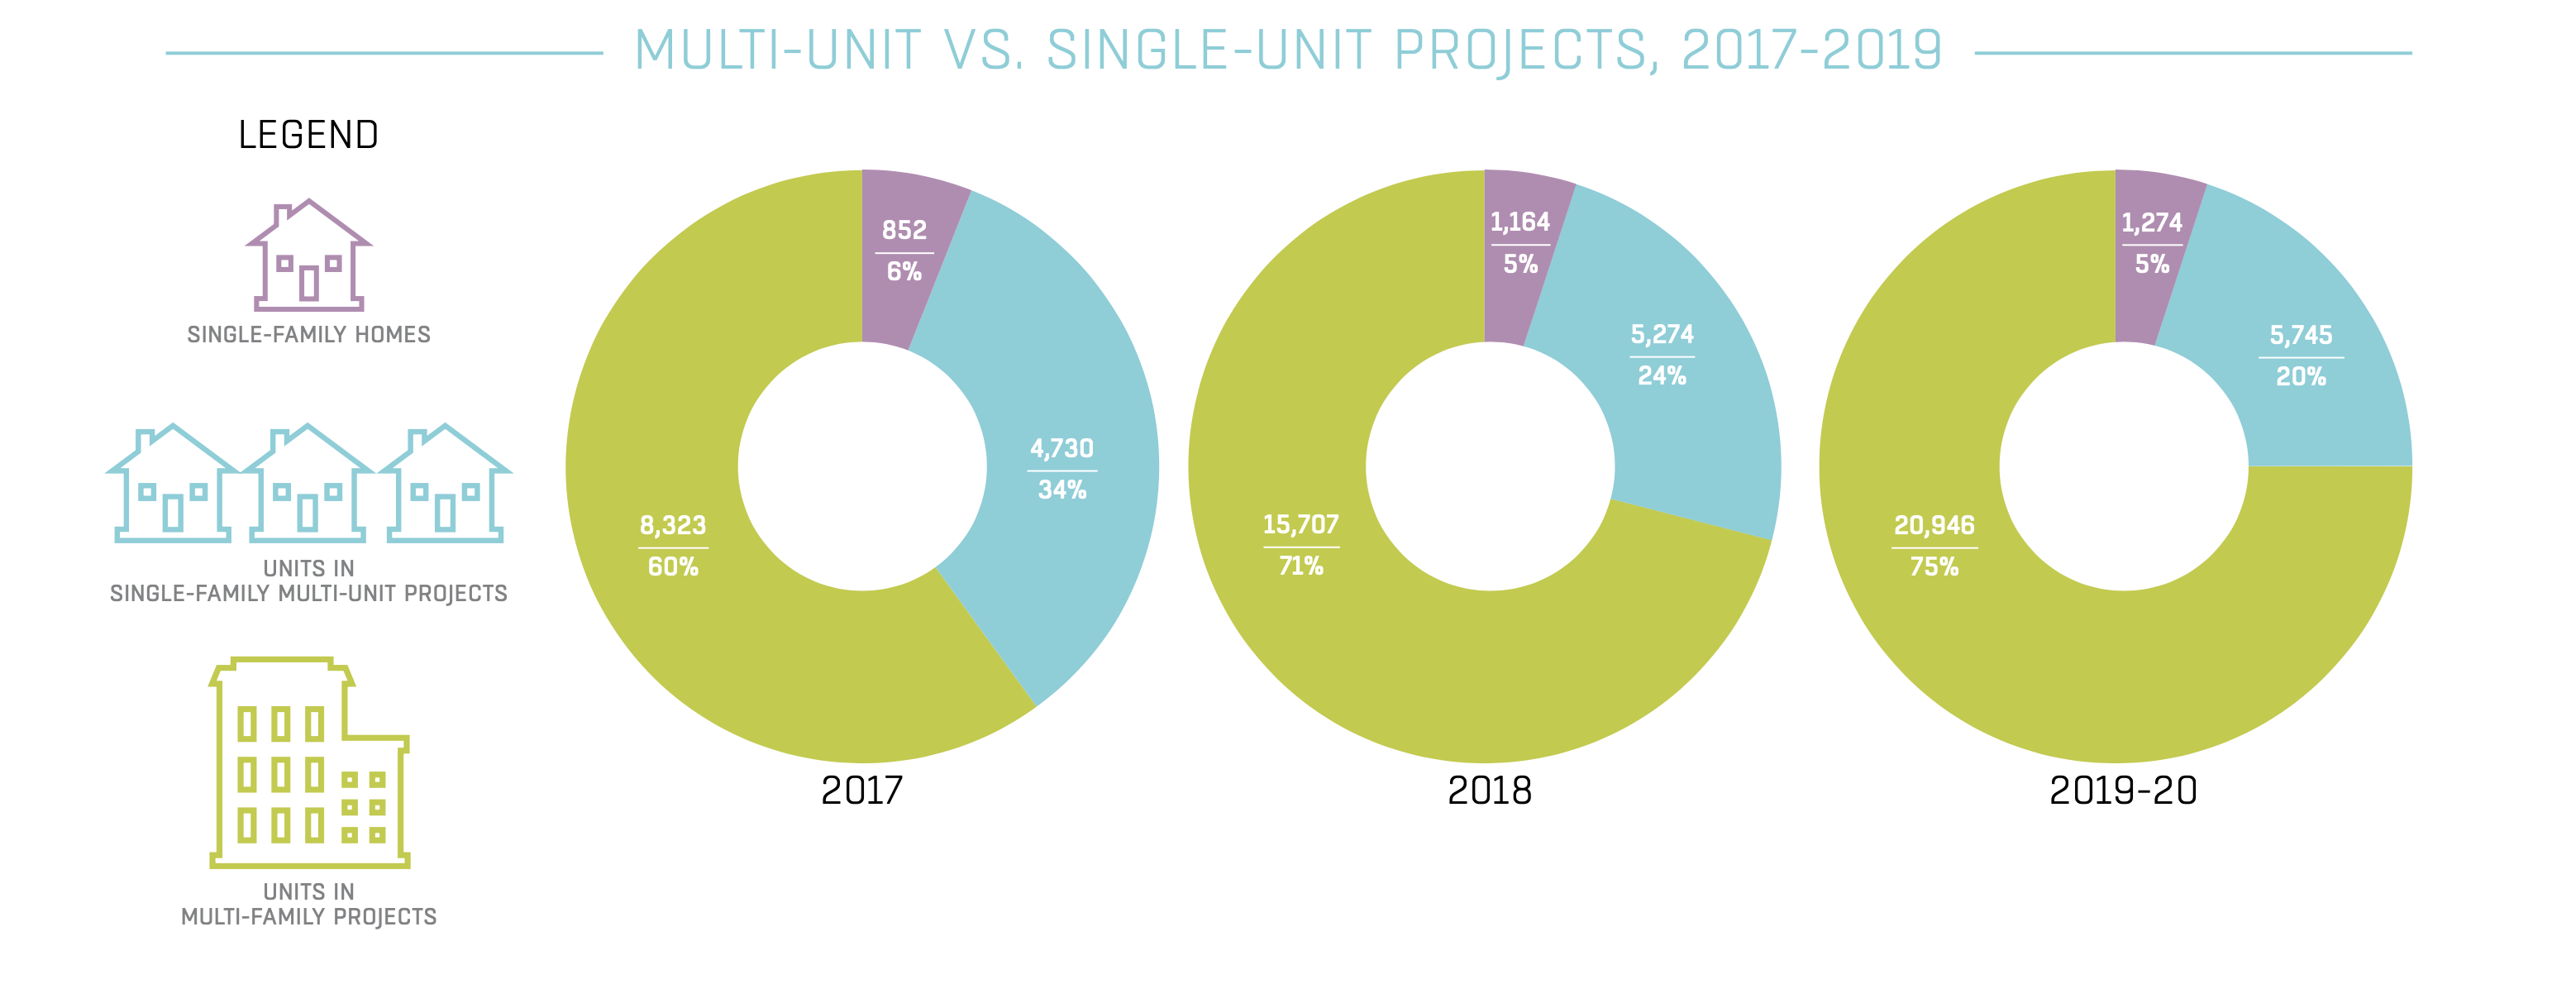
This data shows that more developers are implementing the methods of zero energy use in their single-family multi-unit projects and multifamily homes. One clear take away from the study is that nearly all residential construction activity for zero energy units are driven by the business of home building, not by private individuals.
Developers are taking notice of this good business practice, and implementing zero energy into more of their projects—not just the niche market of eco-conscious homeowners.
In 2019/20, 75% of ZE units came from multifamily development, 20% from units in single-family multi-unit projects, and only 5% in single-family homes. While the multifamily numbers have gone up since 2017, the others have either gone down or stayed relatively unchanged.
THE GEOGRAPHY OF ZERO
In the United States, multifamily housing developments make up 73% of zero-energy units, compared to the remaining 27% belonging to single-family.
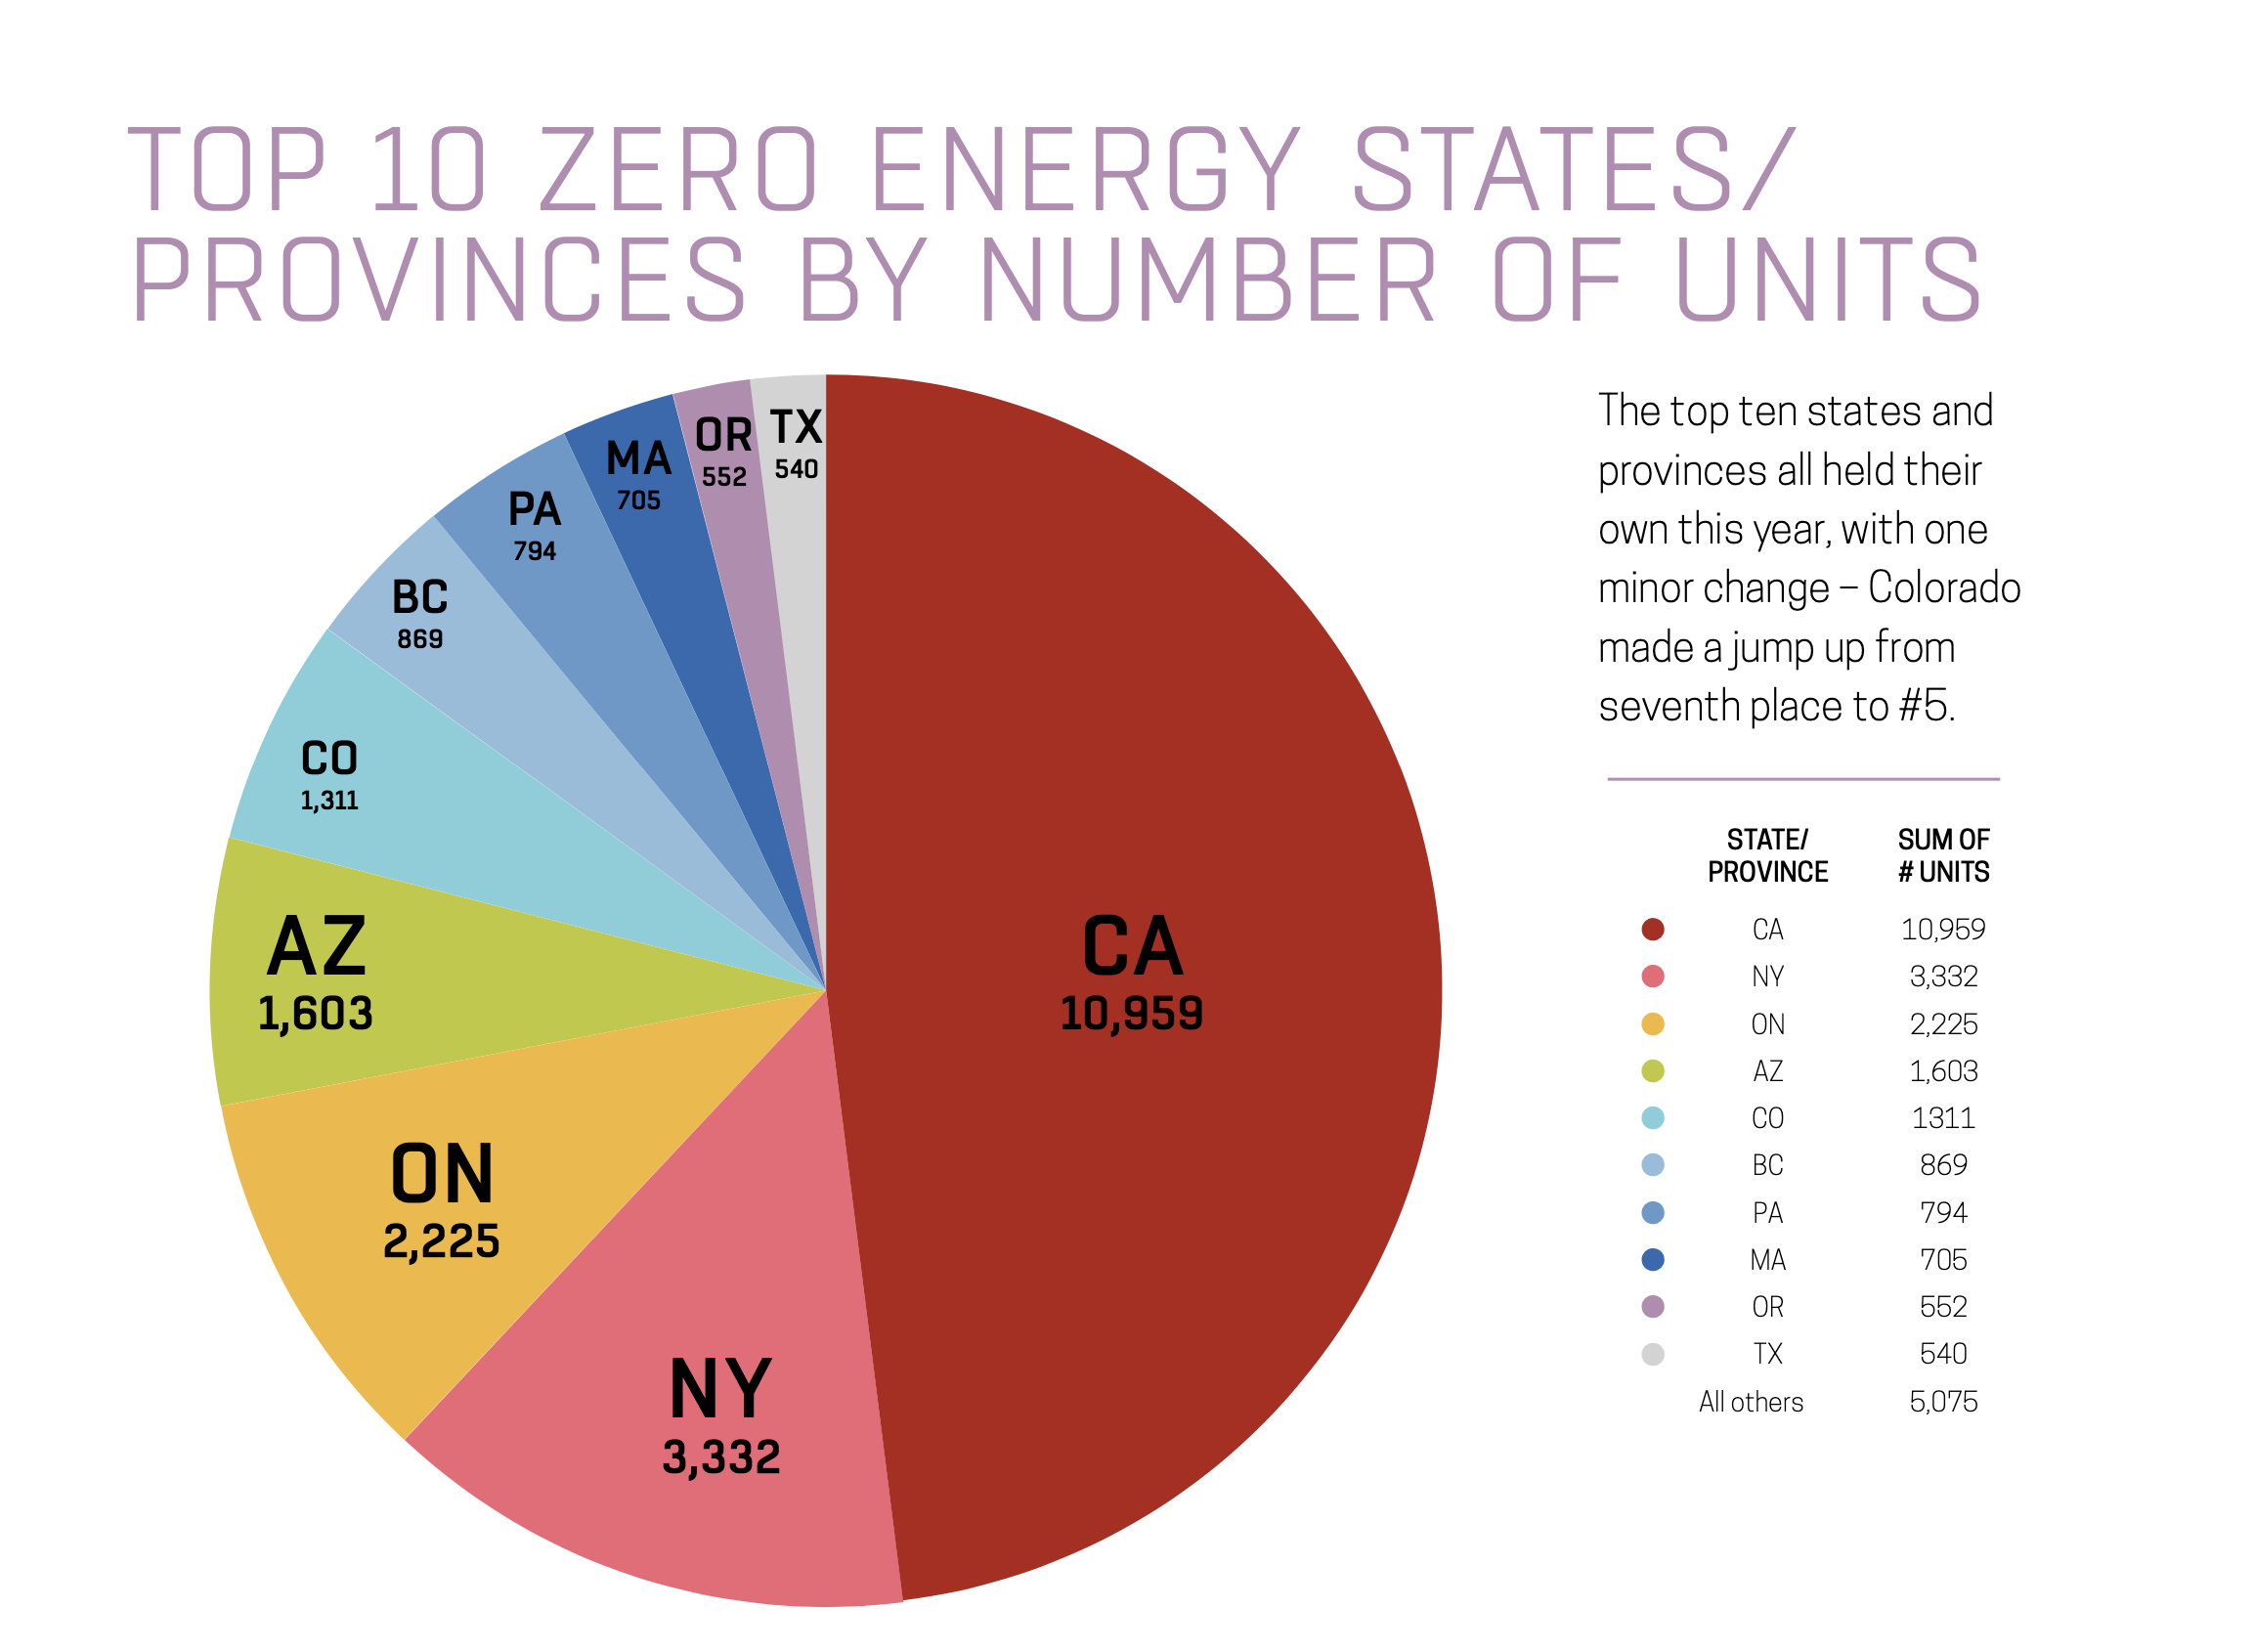
Among these units, California ranks as one of the highest ranked states for top 20 zero energy cities. The state has over 10,000 units, making up almost half of the amount of zero energy units in the entire United States.
New York, Arizona, and Colorado make up some of the top 5 states, with 3,332; 1,603; and 1,311 units respectively.
As for individual cities, New York makes the top of the U.S. list with over 1,800 zero energy units. Davis, California sits right below with 759 units; while Denver, Colorado is not too far behind with 709 units.
For more information, graphs, and examples of ZE Star Projects, and to read the full report, click the DOWNLOAD THE REPORT button below.


