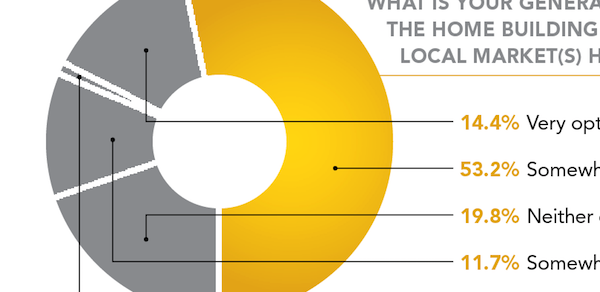
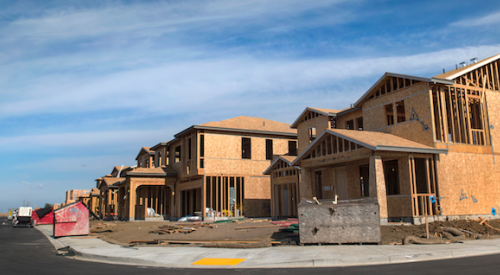
More than a quarter of builders, designers, and architects responding to Professional Builder’s 2016 Market Forecast survey graded this year as mediocre or poor, an improvement from more than a third that rated 2014 as a bad year for their companies. About 46 percent of builders said that they sold more houses this year versus last year, and 40 percent indicated that they sold “about the same.” Less than 14 percent closed on fewer homes than they did in 2014 compared with 22.2 percent from the previous year’s poll.
Annual revenue compared with 2014 increased for 51 percent of survey respondents, and more than 60 percent anticipate that their sales dollars will grow in 2016. Most survey participants also see the industry continuing to benefit from the upside of the cycle as 66 percent expect next year will be good or very good for their operations.
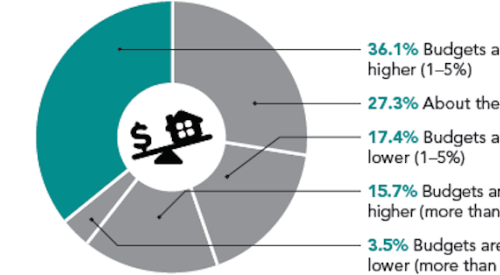
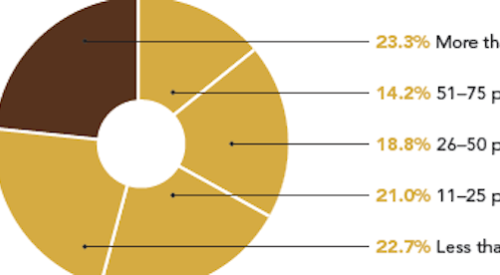
For more survey results about 2016 expectations, see the charts that follow.
METHODOLOGY & RESPONDENT INFORMATION
This survey was distributed between Oct. 22 and Nov. 13, 2015, to a random sample of Professional Builder’s print and digital readers. No incentive was offered. By closing date, a total of 114 eligible readers returned completed surveys. Respondent breakdown by discipline: 31.8 percent custom home builder; 20 percent diversified builder/remodeler; 19.1 percent production builder for move-up/move-down buyers; 11.8 percent architect/designer engaged in home building; 5.5 percent production builder for first-time buyers; 4.6 percent luxury production builder; 2.7 percent manufactured, modular, log home, or systems builder; and 4.6 percent other. Approximately 41.3 percent of respondents sold one to five homes in 2015, and 22 percent sold more than 50 homes.
Download the PDF at the end of this online article to see the base number of survey respondents for each survey question.


