This month we look at two Midwestern cities where the employment situation has had a significant affect on the housing market. One market is very affordable and growing rapidly, while the other is overpriced and oversupplied.
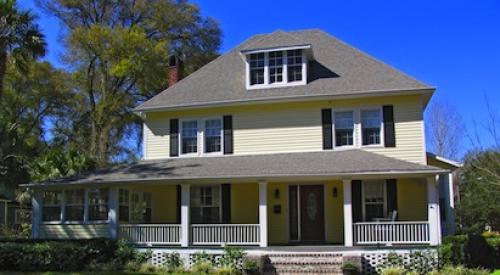
Columbus, OhioLocated between the manufacturing cities of Cleveland to the north and Cincinnati to the south, Columbus has emerged as one of the fastest-growing cities in the Midwest. Largely known for its contributions to education through Ohio State University, Columbus also has a strong financial services economy.
After experiencing solid job growth of 3 percent per year from 1994 to 2000, employment growth slowed and losses occurred in 2002 and 2003. Lately, the employment picture has improved, with 9,200 jobs added in the last year, 3,100 of which were in high-paying job sectors. The unemployment rate has fallen to 4.8 percent. Our Housing Cycle Barometer rating for Columbus is currently 3.1, making the market and its median resale price of $133,000 one of the more affordable in the nation.
Downtown Columbus has experienced a resurgence with the development of residential projects surrounding the city's professional hockey arena, an area once marked by old office buildings and parking lots. The success of this neighborhood has created opportunities for other downtown neighborhoods, attracting young people into the city.
The Columbus building industry has slowed along with the rest of the country, but Columbus has a better outlook than most Midwestern areas. Columbus' highly educated population and its central location within a one-day truck drive to 60 percent of the factories and 60 percent of the population in the U.S. bode well for its future. A forthcoming intermodal station at Rickenbacker Airport, a former Air Force base, will be able to handle 250,000 containers a day, and 20 million square feet of additional warehouse space is planned around the station.
Warren, Mich.The Detroit economy is a sharp contrast to the Columbus economy. Home to the nation's struggling automobile industry, job losses have slowed Michigan's Warren-Farmington Hills-Troy metropolitan area, which comprises the five counties to the north of Wayne County, where Detroit is located. Nearly 400,000 people are employed by the manufacturing and trade, transportation and utilities industries in this area.
After very strong job growth from 1992 to 2000, Warren lost more than 73,000 jobs from 2001 to 2004. In the last year, layoffs by car manufacturers have led to a net loss of 5,300 jobs just in the auto industry, and the entire area has lost 5,600 jobs.
The decline in employment growth has affected prices in Warren. Warren has not experienced the level of price appreciation that many other markets did during the early part of the decade. The median resale home price in this market has risen only $6,000 in the last five years, to $195,000. Employment losses have also slowed the pace of new home construction, but the 9,900 units constructed in the last year is far more than is needed.
| Employment | Affordability | Permits | ||||||||||
| Short-Term Outlook/Grade | 1-Year Payroll Employment Growth | 1-Year Growth Rate | Unemployment Rate | Median Resale Home Price | Resale Housing Costs as % of Income* | Housing Cycle Barometer** | 12-Month Single-Family Permits | 1-Year Single-Family Growth | 12-Month Total Permits | Total Permits as % of Peak Permits*** | ||
| 1 | Atlanta | B | 60,700 | 2.6% | 4.2% | $173,377 | 29% | 5.7 | 61,557 | 7% | 75,043 | 100.0% |
| 2 | Phoenix | B+ | 97,800 | 5.5% | 3.6% | $260,000 | 41% | 6.7 | 57,169 | -5% | 66,497 | 96.1% |
| 3 | Houston | B | 63,900 | 2.7% | 4.9% | $145,200 | 25% | 5.2 | 52,451 | 13% | 64,400 | 85.7% |
| 4 | Riverside-SB | D | 22,300 | 1.8% | 4.3% | $384,000 | 69% | 9.7 | 45,531 | 6% | 51,453 | 89.2% |
| 5 | Dallas | A | 60,600 | 3.1% | 4.7% | $157,800 | 26% | 5.0 | 31,819 | 0% | 38,826 | 52.5% |
| 6 | Las Vegas | B | 47,500 | 5.5% | 4.0% | $301,750 | 50% | 7.4 | 31,539 | 8% | 43,796 | 100.0% |
| 7 | Chicago | C | 40,600 | 1.1% | 4.8% | $243,500 | 42% | 6.8 | 29,480 | 8% | 46,600 | 100.0% |
| 8 | Tampa | C+ | 30,600 | 2.4% | 2.7% | $194,700 | 40% | 6.5 | 27,038 | 12% | 32,158 | 84.8% |
| 9 | Orlando | B+ | 43,700 | 4.2% | 2.6% | $243,000 | 44% | 6.6 | 26,367 | -6% | 34,385 | 95.2% |
| 10 | Washington, D.C. | B+ | 58,900 | 2.5% | 3.0% | $400,000 | 50% | 7.3 | 21,686 | -6% | 31,057 | 81.8% |
| 11 | Fort Myers | D+ | 12,800 | 5.8% | 2.1% | $335,201 | 61% | 10.0 | 21,373 | 15% | 28,689 | 97.8% |
| 12 | Charlotte | B | 16,400 | 2.1% | 4.1% | $163,000 | 28% | 3.7 | 20,214 | 14% | 23,936 | 100.0% |
| 13 | Austin | B+ | 22,500 | 3.3% | 3.9% | $172,200 | 31% | 5.2 | 19,265 | 31% | 26,711 | 100.0% |
| 14 | Fort Worth | B | 20,600 | 2.5% | 4.6% | $115,300 | 20% | 5.2 | 18,959 | 18% | 21,306 | 55.3% |
| 15 | Jacksonville | B+ | 23,200 | 3.9% | 2.8% | $180,000 | 32% | 5.8 | 18,184 | 15% | 23,610 | 94.1% |
| 36 | Port St. Lucie | C+ | 3,200 | 2.5% | 2.9% | $235,000 | 48% | 7.5 | 8,655 | 0% | 10,291 | 95.4% |
| 37 | Warren, MI (Detroit) | F | (5,600) | (0.5%) | 6.1% | $195,749 | 35% | 6.5 | 8,651 | -32% | 9,909 | 50.1% |
| 38 | Philadelphia | C | 18,500 | 1.0% | 4.3% | $222,675 | 34% | 7.0 | 8,407 | 8% | 12,191 | 68.4% |
| 39 | Charleston | B | 12,300 | 4.4% | 4.9% | $187,000 | 36% | 5.1 | 8,373 | 10% | 10,931 | 100.0% |
| 40 | Baltimore | D+ | 20,000 | 1.6% | 3.7% | $283,601 | 42% | 10.0 | 8,337 | 7% | 10,902 | 55.8% |
| * Annual Mortgage Costs + 1/7 of the downpayment divided by income ** Proprietary affordability scale with 0 meaning most affordable time since 1983, 5 meaning median affordability, and 10 meaning least affordable time. *** Peak activity since 1985. Sources: Bureau of Labor Statistics: Census Bureau through the month ending April 2006; John Burns Real Estate Consulting | ||||||||||||
| Author Information |
| John Burns helps many of the largest companies in the industry with strategy and monitoring market conditions. He can be reached at jburns@realestateconsulting.com. |
PB Topical Ref