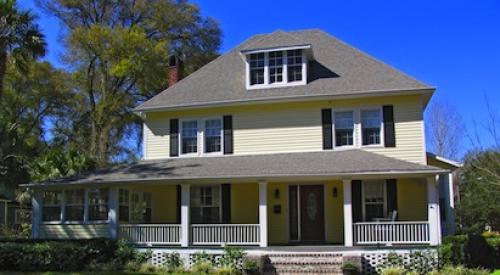
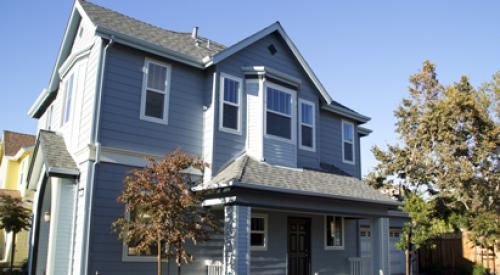
Although we see signs of improvement in new- home sales, we believe these are primarily incentive-driven, and the market correction that began taking shape in 2006 is far from over. One reason we are cautious is that there are currently 2.1 million vacant homes for sale, which is 800,000 more than usual. This excess inventory of unoccupied homes will need to be burned off before we will experience stability nationwide.
Market StrengthRegions where the run-up in prices was not as drastic in this cycle — the Carolinas, Georgia, Southern Texas, the Pacific Northwest and the Plains regions — are experiencing only slight corrections. In Florida, the Midwest, the Gulf States and the Rockies, we consider the housing markets to be weak, while most other regions continue to soften.
Each key market has its own story:
- FLORIDA: The housing market is soft in Northern and Central Florida but is showing signs of stabilization. Builders continue to respond to the soft market by applying for fewer permits. They're also cautiously moving forward with large-scale projects in Orlando and Jacksonville. The housing market remains weak in southwest Florida, where sales for high-end and low-end homes remain healthier than the bulk of homes for sale in the mid-level segment and in Southeast Florida. Recent price concessions have generated substantial sales activity.
- CALIFORNIA: The California housing market remains weak. Any signs of improvement in the state's new-home market can be attributed to large discounts and incentives. We believe some of the trends in residents' moving out of the area are directly related to housing affordability. Northern and central California have experienced the steepest pullback in single-family permits over the last 12 months.
- SOUTHWEST: The major Southwest markets are soft, but there are some indications of stabilization. Key indicators to watch in the recovery efforts in this region will be foreclosure activity and supply levels. Despite slower sales in both new and existing homes in Las Vegas, the market continues to eat through inventory. Large builders in the Phoenix and Tucson markets have reacted to stalled market conditions by offering substantial discounts, which has improved sales volumes.
- TEXAS: The Texas housing markets remain very competitive. Public and private builders continue to expand in southern Texas, where slim profit margins are by and large based on volume. Competition is fierce for homes in middle-of-the-market price points. In northern Texas, Dallas/Fort Worth continues to slow, as the high level of new-home inventory on the market has led to some price discounts and incentives. There is increased pressure on public builders in this market to reduce the level of inventory to achieve desired profits. As home price appreciation slows, the number of investors in the market is expected to drop.
- MIDWEST: The Midwest's consumer confidence is the lowest in the nation and will need to improve for the housing market to rebound. Job losses continue to plague Michigan's metropolitan areas, and builders have shown restraint by slowing permit activity significantly. Most of the other major metro areas are reporting quarterly permit totals that are down 50 percent from one year prior. Affordability has generally improved in the Midwest markets as prices have flattened.
- EAST COAST: The Northeast and New England region continues its downward market correction, as median home prices and permits decline. Prices have come down in many markets, improving affordability. However, the region experienced high outbound population flows again in 2006, according to a study by United Van Lines.
- THE CAROLINAS AND GEORGIA: Market conditions remain relatively stable in the Carolinas and Georgia, where affordability levels are generally at or below the historical median. Atlanta sales have slowed, while sales in the Carolinas remain strong. New home construction has not slowed much, which is making this market quite challenging for home builders. In the Carolinas, the expectations for home price increases are positive for 2007.
- OTHER REGIONS: Conditions in the Mid-Atlantic market remain soft. The number of resale listings has started to decrease in most of the major metros, most noticeably in Washington, D.C. Builders continue to respond to the soft market conditions by applying for fewer permits. The stability of prices within the Pacific Northwest markets is largely due to continued job growth. Prices continue to decline within the major markets in the Plains region, and job growth over the last 12 months remains below the U.S. average. Builders continue to cut back on permits in the Plains states. The Gulf States region continues to struggle in the wake of Hurricane Katrina, though some builders have announced plans for expansion in the Gulf region.
| EMPLOYMENT | AFFORDABILITY | PERMITS | ||||||||||
| Short-Term Outlook/Grade | 1-Year Payroll Employment Growth | 1-Year Growth Rate | Unemployment Rate | Median Resale Home Price | Resale Housing Costs as % of Income** | Housing Cycle Barometer* | 12-Month Single-Family Permits | 12-Month Single-Family Growth | 12-Month Total Permits | Total Permits as % of Peak Permits*** | ||
| 1 | Houston | 73,100 | 3.0% | 4.0% | 140,700 | 25% | 4.7 | 54,654 | 6% | 68,839 | 92% | |
| 2 | Atlanta | 51,600 | 2.2% | 4.2% | 176,299 | 25% | 4.1 | 52,503 | -15% | 66,591 | 90% | |
| 3 | Phoenix | 88,800 | 4.8% | 3.3% | 258,000 | 39% | 6.5 | 38,732 | -36% | 45,510 | 65% | |
| 4 | Riverside-San Bernardino | 29,300 | 2.4% | 4.4% | 389,000 | 64% | 9.2 | 32,229 | -30% | 37,366 | 65% | |
| 5 | Dallas | 51,200 | 2.6% | 4.0% | 150,400 | 25% | 3.4 | 27,605 | -13% | 37,190 | 50% | |
| 6 | Chicago | 46,100 | 1.2% | 3.8% | 240,000 | 37% | 5.3 | 22,775 | -22% | 40,476 | 89% | |
| 7 | Orlando | 33,300 | 3.1% | 2.9% | 247,800 | 41% | 7.1 | 22,672 | -14% | 29,938 | 83% | |
| 8 | Las Vegas | 45,900 | 5.1% | 4.2% | 300,000 | 48% | 7.1 | 20,591 | -34% | 30,897 | 75% | |
| 9 | Charlotte | 13,200 | 1.6% | 4.6% | 157,000 | 25% | 1.0 | 20,361 | 4% | 25,848 | 100% | |
| 10 | Tampa | 26,800 | 2.0% | 3.0% | 196,000 | 36% | 6.3 | 17,160 | -38% | 21,596 | 57% | |
| 11 | Austin | 21,600 | 3.1% | 3.2% | 173,900 | 31% | 5.1 | 16,798 | -9% | 26,112 | 97% | |
| 12 | Washington, D.C. | 58,600 | 2.5% | 2.9% | 403,353 | 48% | 8.4 | 15,999 | -29% | 23,150 | 61% | |
| 13 | Fort Worth | 14,000 | 1.7% | 4.0% | 106,600 | 19% | 3.7 | 15,121 | -18% | 19,257 | 50% | |
| 14 | Nashville | 16,300 | 2.2% | 3.5% | 144,700 | 25% | 3.2 | 13,626 | -4% | 15,346 | 84% | |
| 15 | Fort Myers | 8,400 | 3.6% | 2.5% | 250,000 | 42% | 6.4 | 13,583 | -39% | 17,300 | 59% | |
| 16 | San Antonio | 20,100 | 2.5% | 3.7% | 142,900 | 29% | 5.2 | 13,383 | -11% | 18,419 | 79% | |
| 17 | Raleigh-Cary | 19,300 | 4.1% | 3.4% | 179,000 | 27% | 0.7 | 13,376 | -5% | 16,690 | 95% | |
| 18 | Denver | 17,300 | 1.4% | 4.0% | 232,000 | 36% | 5.4 | 12,393 | -31% | 17,585 | 62% | |
| 19 | Minneapolis | 34,000 | 1.9% | 3.8% | 232,950 | 32% | 6.0 | 11,451 | -34% | 15,231 | 54% | |
| 20 | Seattle | 39,300 | 2.8% | 4.2% | 390,000 | 55% | 9.0 | 10,938 | -14% | 21,588 | 78% | |
| Sources: Bureau of Labor Statistics; Census Bureau through the month ending January 2007; John Burns Real Estate Consulting. Data on all markets available at www.realestateconsulting.com *Proprietary affordability scale with 0 meaning most affordable time since 1983, 5 meaning median affordability, and 10 meaning least affordable time. **Annual Mortgage Costs +1/7th of the downpayment divided by income. *** Peak activity since 1985. | ||||||||||||
| Author Information |
| Chris Porter of John Burns Real Estate Consulting also contributed to this report. |
| John Burns helps with strategy and monitoring market conditions with many of the largest companies in the industry. He can be reached at jburns@realestateconsulting.com. |


