Featured Major Market: Los Angeles
If you don't build it, they will come anyway. If you are dealing with government agencies or citizens groups who believe that if they don't build the housing, people won't come, take them on a tour of Los Angeles. Los Angeles is the "poster child" for how a lack of adequate new housing near employment centers can affect an economy.
Los Angeles still has fewer jobs today than it did in 1990. That's right, 15 years with zero net added jobs. During the 1990s, Los Angeles lost jobs, built only 111,000 homes, and added more than 650,000 people. That's right too, only one housing unit for every 5.1 people who moved in. The result has been a pretty miserable deterioration of a great area.
That being said, some great things are finally happening. Downtown Los Angeles is slowly revitalizing. The Playa Vista community is adding thousands of new homes after more than 20 years of entitlement battles, and Lennar will soon be bringing to market the next phase of Newhall Ranch, which will include more than 10,000 housing units. Standard Pacific, Lennar and others have formed urban infill divisions to build podium and high-rise housing for a community greatly in need of it. Still, there is not enough volume for many builders to support operations, so they have stretched their geographic territories to Bakersfield to get enough sales.
Thanks to the activities of the elite NIMBY homeowners, some of whom are famous celebrities, entry-level homes in the distant desert community known as The Antelope Valley now cost more than $300,000, and come with a 90 minute commute to work. These multi-millionaire celebrities are proud of the open space they've saved at the expense of jobs and homeownership for the working class. With 50% of California owned by government agencies, 95% of California currently undeveloped, and a fairly sizeable body of water to the west, it is difficult to say that California needs more open space. This may be the country's most extreme example of NIMBYism.
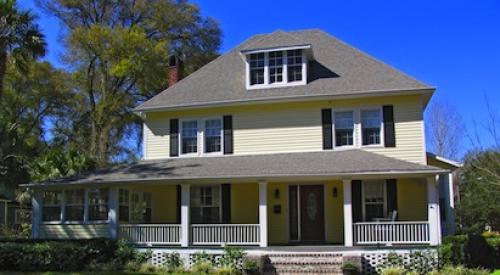
Featured Up-and-Coming Market: Daytona BeachEvery February, tens of thousands of NASCAR fans descend on Daytona Beach for one of the most well-known sporting events in the country. With more than 10,000 single-family homes built in Daytona Beach in the last year, it is clear that not all of them make it home.
Already the 35th largest single-family housing market in the country, Daytona Beach will be one of the major housing stories over the next 20 years. Growth in Jacksonville to the north, and Orlando to the south, will make Daytona Beach a much more desirable location. Daytona Beach already boasts some of the best weather in the country, and it increasingly adds to its economic base, with 5,500 jobs created in the last year (3.1% growth).
The Daytona Beach metro area has three distinct submarkets:
- Palm Coast in the north, which is popular with retirees,
- DeLand in the west, which is popular with Orlando employees looking for more home for their money, and
- The City of Daytona Beach, which is a mix of retirees and young people.
With a median home price of only $123,000, housing costs that represent only 22% of the avearage area income, outstanding year-round weather, and NASCAR-led tourism, Daytona Beach is a market that should continue to perform very well in the future.
| Employment | Affordability | Permits | ||||||||||
| Short-Term Outlook/Grade | 1-Year Payroll Employment Growth | 1-Year Growth Rate | Unemployment Rate | Median Resale Home Price | Resale Housing Costs as % of Income | Housing Cycle Barometer | 12-Month Singer-Family Permits | 1-Year Single-Family Growth | 12-Month Total Permits | Total Permits as % of Peak Permits | ||
| 1 | Atlanta | B | 25,200 | 1.2% | 4.2% | $162,790 | 23% | 4.7 | 55,388 | 3% | 71,237 | 98% |
| 2 | Phoenix | B+ | 45,600 | 2.7% | 3.2% | $178,950 | 30% | 5.0 | 58,144 | 24% | 64,889 | 96% |
| 3 | Houston | B+ | 34,900 | 1.7% | 5.5% | $132,100 | 22% | 0.9 | 43,160 | 26% | 52,875 | 85% |
| 4 | Riverside | B | 30,900 | 2.8% | 4.6% | $296,250 | 49% | 5.6 | 43,434 | 21% | 52,090 | 90% |
| 5 | Las Vegas | A+ | 44,600 | 5.3% | 3.5% | $260,000 | 44% | 4.5 | 35,687 | 18% | 40,923 | 82% |
| 6 | Washington D.C. | B+ | 78,800 | 2.8% | 2.9% | $420,000 | 47% | 6.5 | 29,700 | (4%) | 40,114 | 84% |
| 7 | Chicago | C | 11,400 | 0.3% | 5.7% | $228,500 | 38% | 6.4 | 32,697 | 5% | 39,001 | 83% |
| 8 | Dallas | B+ | 18,000 | 0.9% | 5.5% | $148,200 | 24% | 0.4 | 31,068 | 16% | 36,038 | 49% |
| 9 | Orlando | B+ | 22,200 | 2.3% | 3.8% | $172,250 | 30% | 5.1 | 27,392 | 22% | 33,463 | 93% |
| 10 | Tampa | B+ | 26,200 | 2.1% | 3.5% | $148,000 | 30% | 5.2 | 23,100 | 15% | 29,070 | 77% |
| 11 | Los Angeles | C | 25,900 | 0.6% | 5.7% | $432,000 | 76% | 7.0 | 12,216 | 19% | 27,852 | 40% |
| 12 | Minneapolis | B+ | 16,300 | 0.9% | 3.8% | $222,000 | 28% | 5.5 | 20,065 | (2%) | 26,973 | 91% |
| 13 | Austin | B+ | 6,100 | 0.9% | 4.0% | $147,600 | 24% | 1.4 | 18,255 | 54% | 23,177 | 87% |
| 14 | Charlotte | A | 24,100 | 2.9% | 5.2% | $156,000 | 27% | 0.1 | 18,674 | 9% | 22,791 | 93% |
| 15 | Fort Myers | B+ | 6,800 | 3.5% | 3.3% | $100,125 | 17% | 1.0 | 15,382 | 62% | 21,399 | 98% |
| 16 | Miami | C | 17,700 | 1.7% | 5.4% | $278,708 | 59% | 7.9 | 9,505 | 9% | 20,645 | 99% |
| 17 | Detroit | F | (24,600) | (1.2%) | 6.9% | $204,950 | 36% | 6.6 | 16,406 | 6% | 20,408 | 90% |
| 18 | Raleigh | B+ | 17,000 | 2.5% | 3.3% | $174,000 | 28% | 1.41 | 5,999 | 14% | 19,719 | 92% |
| 19 | Sacramento | B | 1,700 | 0.2% | 4.6% | $339,000 | 50% | 6.01 | 6,773 | (2%) | 19,712 | 85% |
| 20 | Seattle | B | 24,700 | 1.8% | 4.9% | $325,000 | 52% | 6.81 | 2,874 | 16% | 19,534 | 69% |
| 21 | Denver | B | 18,300 | 1.6% | 5.1% | $235,563 | 38% | 5.7 | 16,163 | 29% | 19,492 | 70% |
| 22 | Jacksonville | B | 12,400 | 2.2% | 4.2% | $152,950 | 27% | 5.2 | 14,505 | 15% | 19,136 | 98% |
| 23 | Fort Worth | B+ | 7,800 | 1.0% | 5.0% | $99,800 | 17% | 0.01 | 5,456 | 13% | 18,155 | 47% |
| 24 | Philadelphia | B | 5,600 | 0.2% | 4.4% | $189,566 | 28% | 4.61 | 3,053 | 5% | 18,003 | 69% |
| 25 | San Antonio | B+ | 11,300 | 1.6% | 4.5% | $121,500 | 24% | 0.0 | 13,112 | 26% | 17,677 | 95% |
| 26 | Nashville | B+ | 6,800 | 1.0% | 3.5% | $121,000 | 21% | 0.0 | 12,985 | 13% | 17,327 | 95% |
| 27 | Indianapolis | C | (,900) | (0.1%) | 4.8% | $130,786 | 22% | 2.7 | 12,493 | (4%) | 16,077 | 93% |
| 28 | Portland | C | 12,000 | 1.3% | 6.1% | $205,000 | 34% | 5.8 | 11,283 | 8% | 15,838 | 80% |
| 29 | St. Louis | A | 38,800 | 3.0% | 5.6% | $135,000 | 24% | 3.3 | 13,463 | 11% | 15,809 | 86% |
| 30 | San Diego | B+ | 18,500 | 1.5% | 3.2% | $515,000 | 78% | 6.7 | 8,565 | (15%) | 15,341 | 35% |
| 31 | Kansas City | B | 4,100 | 0.4% | 5.4% | $159,350 | 25% | 5.2 | 12,302 | 5% | 15,251 | 83% |
| 32 | West Palm Beach | B | 9,100 | 1.7% | 4.4% | $255,000 | 43% | 5.5 | 10,052 | (10%) | 14,558 | 63% |
| 33 | Sarasota | B+ | 7,000 | 2.4% | 2.7% | $210,000 | 38% | 6.0 | 10,999 | 39% | 14,506 | 100% |
| 34 | Columbus | B+ | 100 | 0.0% | 4.4% | $130,000 | 20% | 0.1 | 9,819 | (15%) | 12,045 | 73% |
| 35 | Daytona Beach | B+ | 5,500 | 3.1% | 4.5% | $123,156 | 22% | 2.6 | 9,302 | 8% | 11,984 | 83% |
| Sources: job data, Bureau of Labor Statistics; one-year calculations, John Burns Real Estate Consulting Sources: permit data, Census Bureau; one-year calculations, John Burns Real Estate Consulting | ||||||||||||


